On the client side (your application) after you have created the sdk object call this line of code.
PxExtensionVisualDebugger::connect(gPhysicsSDK->getPvdConnectionManager(),"localhost",5425, 10000, true);
The parameters are in sequential order the PVD connection manager, the ip of the debugger, the port where the connection will be made, the timeout after which the connection will be dropped. For details about these parameters, consult the help docs of the visual debugger.
Demo run
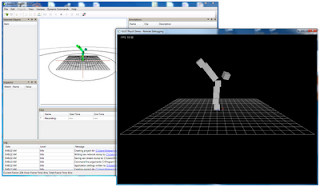
We will now try to see the debugger in action. First, run the visual debugger. Then run your application. You should see all of your objects in the visual debugger. The active objects are green and the inactive (sleep) objects are yellow. This can turn out to be an invaluable tool when we are working on a fairly large project.
That's it for this demo. There is no source code for this tutorial. Just use any of the existing codes and add in the code snippet given earlier and see it in action.
Here is a snapshot of a debugging session.

We will look at how to create joints in the next tutorial.


0 comments:
Post a Comment